
I hit a milestone a couple of years ago that I thought would change my life. Our analytics dashboard showed that our e-commerce brand had crossed $120,000 in monthly revenue.
We were packaging orders until our hands bled. The warehouse was a chaotic sea of cardboard boxes, and my phone was pinging with sales notifications every two minutes. I felt on top of the world.
Then came the first of the month. I opened our business checking account to pay our suppliers and fulfillment partners.
The account was practically empty.
I sat there in the quiet of my office, a cold panic rising in my chest. The math didn’t make any sense. We were clearing six figures a month. Where on earth was the money going?
I actually remember opening a new tab and searching for explanations that weren’t purely technical because I was so desperate. I thought my accountant was making mistakes, or worse, that our payment processor was lagging.
But it wasn’t a glitch. I had walked right into what finance professionals call the Profit Mirage.
You see a massive wave of revenue off in the distance. It looks like an oasis in the desert. But you miss the jagged rocks of hidden unit economics that are slicing your cash flow to pieces on the backend.
If you’ve ever looked at a booming sales chart but found yourself struggling to pay your software bills, this guide is for you. Here is exactly how to use data automation and SKU-level analysis to discover the products secretly bankrupting your business.
Phase 1: The Gross Margin Illusion
Most of us were taught a very simple, incredibly dangerous equation when we started our first business:
{Gross Profit} = {Selling Price} – {Cost of Goods Sold (COGS)}
You buy a product—say, a sleek minimalist coffee table—from a manufacturer for $30. You list it on your site for $90.
Your brain instantly tells you, “Awesome, I made a $60 profit.”
In the modern digital economy, that equation is a complete illusion. That $60 buffer isn’t profit. It’s a piece of meat being tossed into a den of invisible operational hazards.
If you aren’t tracking every micro-transaction tied to that specific item, your true margin evaporates before the cash ever hits your bank.
The Three Silent Killers of Margin
- The Customer Acquisition Cost (CAC) Spike: Years ago, you could run a generic social ad and get cheap, predictable data attribution. Today, privacy updates mean you pay premium rates. If it costs $45 in ad spend to secure that single $90 order, your $60 margin instantly shrinks to $15.
- The Return Rate Penalty: When a customer returns a bulky item, you don’t just lose the sale. You pay for initial shipping, return shipping, warehouse restocking fees, and disposal fees. One single return can wipe out the profit margins of five successful sales.
- The “Time Vampire” Support Burden: If a product is high-maintenance, it drains human resources. Let’s say an item causes three support emails per order because assembly instructions are confusing. When you calculate the hourly wage of your customer service team against that remaining $15 margin, you realize you are paying the customer to take your product.
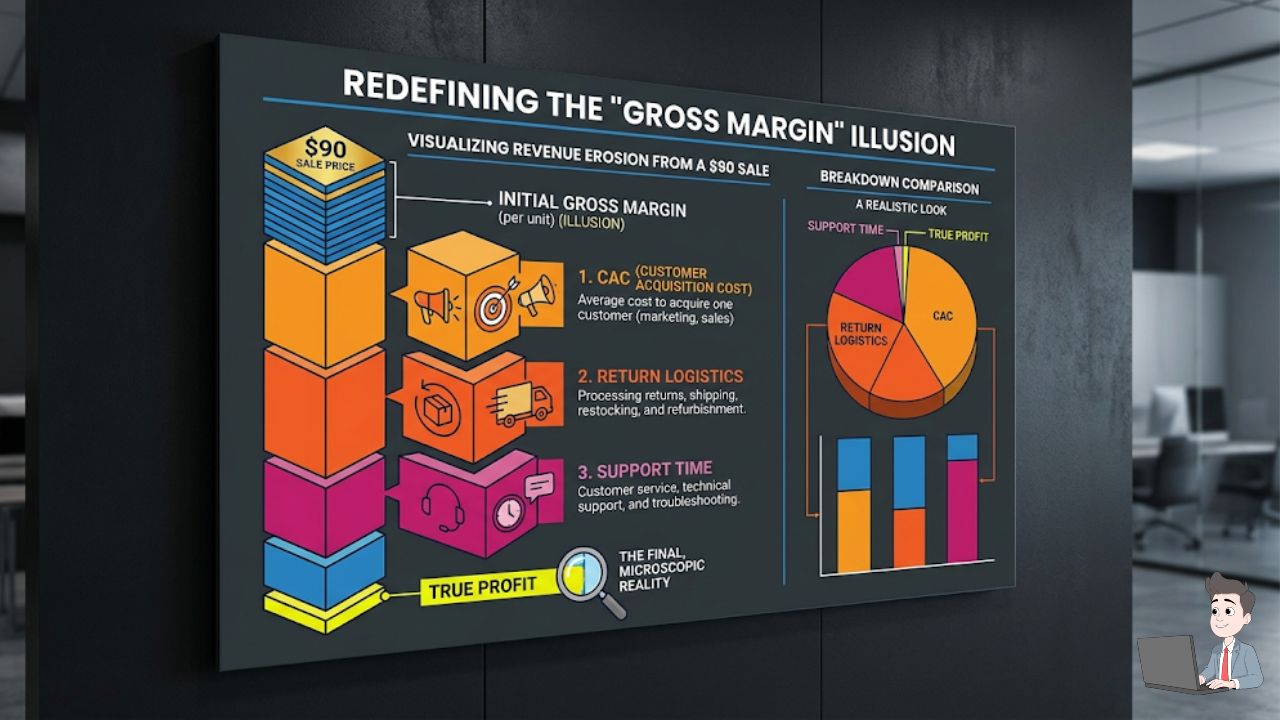
If you want to see exactly how these invisible costs drain your bank account, watch this comprehensive breakdown by the certified e-commerce accountants at LedgerGurus. They explain exactly how to build a unit economics spreadsheet that tracks true net profit.
Phase 2: The Volume Trap (Why Scaling Fails)
When businesses experience a drop in profitability, the instinctual reaction from founders is almost always the same.
“We just need more sales volume. If we scale our budget, the margins will fix themselves.”
This is the exact moment the trap snaps shut.
If your core unit economics are broken—meaning you are net-losing $2 on every unit after ads, shipping, returns, and support—scaling up doesn’t make you richer. It accelerates your path to bankruptcy.
- Selling 100 units means you lose $200.
- Scaling your ads to sell 5,000 units means you just put your business $10,000 in debt.

You cannot out-scale a negative margin. To survive, you have to stop looking at your business as one massive entity. You must start looking at your data at the stock-keeping unit (SKU) level.
Phase 3: The SKU-Level “X-Ray” Analysis
Humans are inherently bad at tracking 50 variables across 100 different products simultaneously.
Real data analysis means creating an automated connection between your ad platforms, your e-commerce store, your shippers, and your customer service desk.
When you run a forensic SKU audit, apply a variation of the classic 10-20-70 Framework:
| Product Classification | Catalog % | Behavioral Characteristics | Action Required |
| The Home Runs | $10\% | High net margins, low return rates, zero support complaints. | Triple the ad budget immediately. |
| The Steady Eddies | $20\% | Moderate profit, low maintenance, consistent sales. | Maintain baseline spend and protect inventory. |
| The Zombies | $70\% | High sales velocity but zero net profit due to hidden operational costs. | Kill or completely re-engineer immediately. |
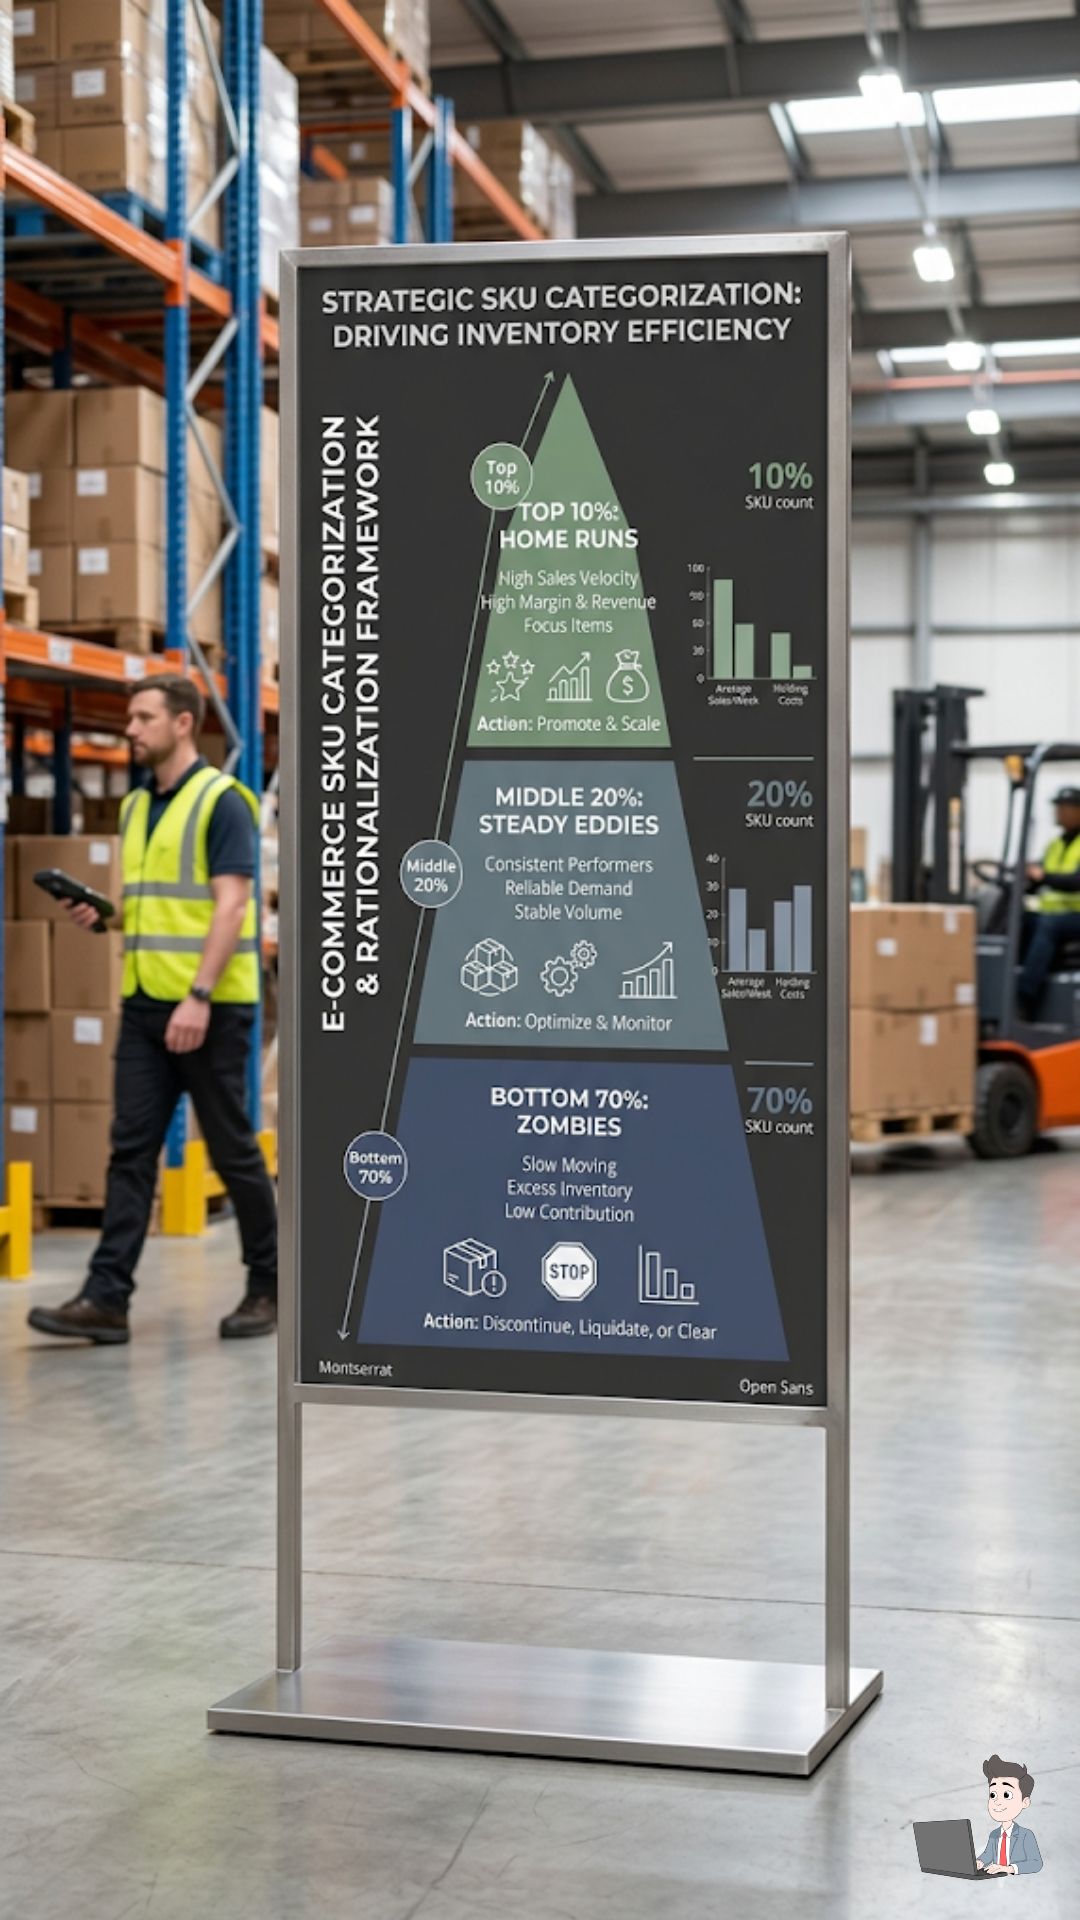
When we hooked up data-enrichment workflows to analyze our true profitability per item, the results were eye-opening.
Our top-selling product was a massive Zombie. It was responsible for $60\%$ of our total customer service complaints and virtually all our return logistics overhead.
We cut the product that weekend. Even though our total revenue numbers dropped, our bank account immediately started filling back up with actual, spendable cash.
Phase 4: Sifting Through the Noise
Because so many owners are feeling this exact cash-flow pressure, the internet is flooded with misleading offers.
If you search for financial fixes online, you will see ads for “AI Wealth Machines” or “Autopilot Profit Generators.” They promise to automate your store and print free money while you sleep.
⚠️ A Note on Software Authenticity
If a tool promises to make money for you on autopilot with zero data input, it is a scam. Real artificial intelligence is an intelligence engine, not an automated money printer. It takes your messy, complicated business logs and strips away the noise so you can see reality clearly.
Look for deep analytics embedded inside legitimate Enterprise Resource Planning (ERP) systems (like NetSuite or QuickBooks Advanced). Alternatively, use specialized tracking tools (like Lifetimely or Triple Whale) that request secure API read-access to your raw store data.
Invest in tools that give you hard, uncomfortable data over comforting lies.
Phase 5: The Margin Reclamation Audit (Your Weekend Homework)
To stop the bleeding in your business today, you don’t need a high-end consulting firm. You just need to run this three-step audit on your catalog this weekend.
Step 1: Isolate Your Product-Specific Ad Spend
Stop looking at your blended ROAS (Return on Ad Spend). Blended metrics allow your “Home Run” products to cover up the massive failures of your “Zombie” products.
- The Move: Break down your ad account by campaign. Match specific ad sets directly to the SKUs they are promoting. Map specific cost-per-click expenses directly to that item’s unit economics.
Step 2: Map Your “Return Density”
Download your returns log for the last 180 days and sort the data by SKU.
- The Move: Identify the top 3 items causing the highest volume of returns. If the description is setting the wrong expectations, rewrite the landing page to be brutally honest. If the product is inherently flawed, drop it from your store entirely.

Step 3: Run a Support Audit
Sit down with your customer service team or open your ticketing platform.
- The Move: Search your tickets for specific product keywords. Calculate how many hours a week your team spends dealing with complaints regarding specific items. If a low-cost item creates high-frequency friction, it is eating your profit margin from the inside out.
The Bottom Line: Focus on Margin, Not Metric Hype
It is incredibly easy to get addicted to the hype of top-line revenue metrics. Telling people your business cleared a million dollars feels amazing for the ego.
But you cannot pay your liabilities with revenue.
The definition of business survival is knowing your numbers down to the absolute decimal point. Don’t let a “Profit Mirage” blind you into scaling a broken system.
Use data automation to shine a bright light into the dark corners of your warehouse. Fire your bad products. Protect your winning SKUs. Remember that running a highly efficient, profitable business will always beat running a massive, bloated machine that leaves your bank account completely dry.
Financial Disclaimer: This article is for educational and informational purposes only. E-commerce metrics, platform algorithms, and operational costs vary wildly by niche and supply chain structures. Consult a certified public accountant (CPA) or corporate financial advisor before making major structural adjustments to your product inventory or business model.